Welcome to the very first article on the blog!
And to kick things off, we are drawing the same parallel as with the beginning of any successful Qlik project: we start by laying the foundations. Our goal is to share our vision with you and to consolidate our experience through content that is accessible, rigorous, and useful.
On this blog, we will cover topics that are both highly technical (scripting, modeling, performance) and broader (modern BI and the Qlik ecosystem).
Why Qlik? The Fundamentals
Often, the data related to your operations (finance, HR, orders, etc.) is stored in one or more databases managed by dedicated software. While these tools are excellent for operational tasks, they rarely offer advanced analytics or statistical capabilities.
One of Qlik’s key use cases is to make this data accessible beyond the users of the management software, while providing superior analysis capabilities.
To achieve this, the major phases of a project are always the same:
- Connect to the source and extract the data.
- Transform it into an optimized data model.
- Create indicators and a meaningful design.
As you have understood, the first step is to master the source. We will focus on the critical phases that are often overlooked:
- Understanding the structure of the data source.
- Exploring its actual content to prepare for modeling.
These steps are essential for any high-performing analytical model—discover how to master them.
Phase 1 – Understanding the Structure and Logic of the Database
Most Qlik projects rely on one or more databases originating from business applications: financial management, HR, production, or logistics. These systems store data in a relational model optimized for operations but rarely designed for analytics.
For the developer, this first phase feels like the work of a miner: documentation is often incomplete, and the relationships between tables are far from explicit. It is often tedious and highly technical.
To avoid moving forward blindly, a mapping of the database is essential. We will share tools and tips to speed up and industrialize this crucial step of identifying:
- The relevant schemas and tables
- The implicit relationships and functional keys
- The fields that carry business value
Mastering this mapping is key to simplifying the rest of the project and preparing your Qlik data model.
Accessing the Schema
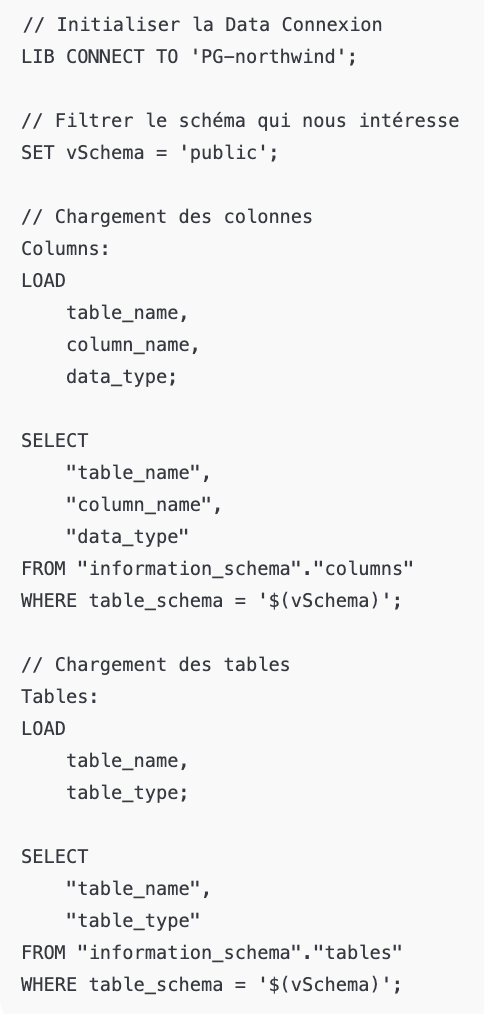
The first step is to retrieve the complete schema of the database to obtain a detailed view of its structure. Let’s take the example of a PostgreSQL database, though the equivalent can be done for other technologies.
A simple script allows you to automatically list all tables and columns. You just need to connect by providing the connection string, then execute the following script:
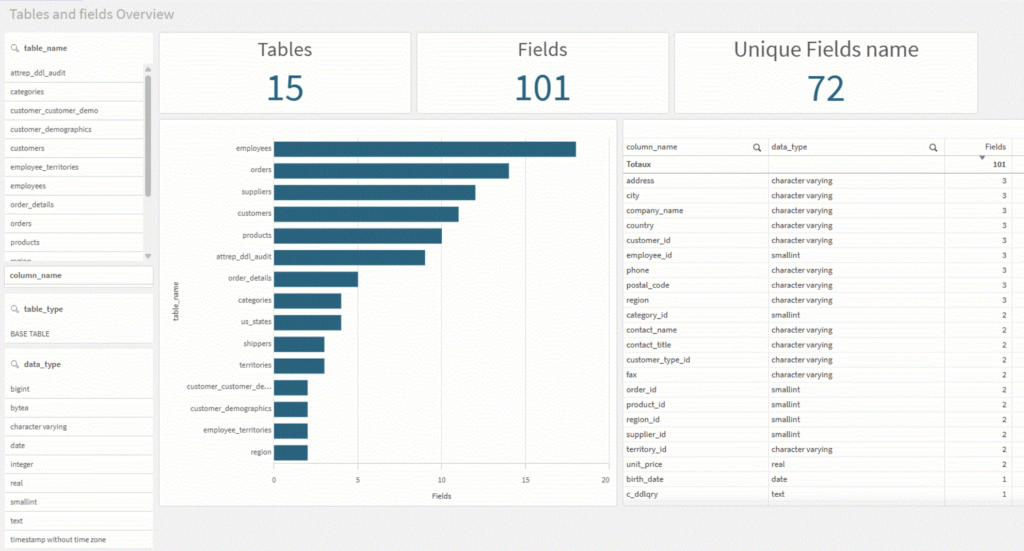
Thanks to this extraction, you can quickly create a structural exploration dashboard showing: tableau de bord d’exploration structurelle décrivant :
- The list of tables
- The field types
- The presence of keys
Why is this mapping essential ?
This initial analysis allows you to:
- Assess the quality of the relational model
- Anticipate the transformations required for an analytical model
- Identify unnecessary technical fields
- Understand the data granularity
- Detect fact tables, dimension tables, or mixed tables
- Identify the keys and relationships between tables
This is the stage where you start imagining the final structure of the Qlik model, keeping in mind that the original model will never be used as is.
Transformations, merges, and enrichments will always be necessary.
Phase 2 – Exploring the Actual Content to Prepare for Modeling
Once the structure of the database has been mapped, the next step is to extract the data so it can be explored in Qlik. This phase must be optimized for speed, as it will be repeated until all relevant data has been identified.
Extraction Strategy Based on Data Volume
The way we extract the data depends heavily on the size of the source tables:
- Reasonable Volume: We perform a full load of all data rows.
- Large Volume: For very large tables, we prefer partial loading.
The Extraction Script and the Role of the QVD
Our approach is to perform a “SELECT *” on all relevant tables in the data model and immediately store them in QVD files. QVD.
This initial load is done using a fairly simple script, as shown here:
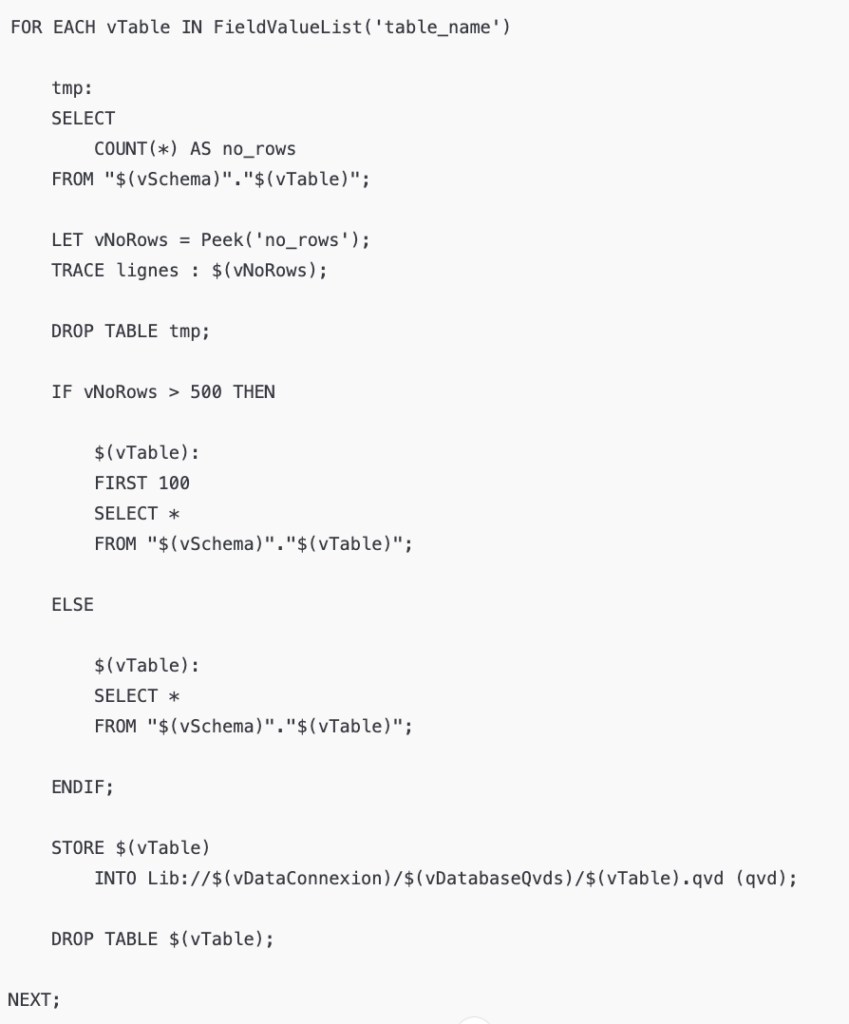
This method offers two major advantages:
- Speed: The QVD is an optimized format for Qlik, making future reloads nearly instantaneous.
- Separation: QVDs act as a raw storage layer, isolated from transformation logic.
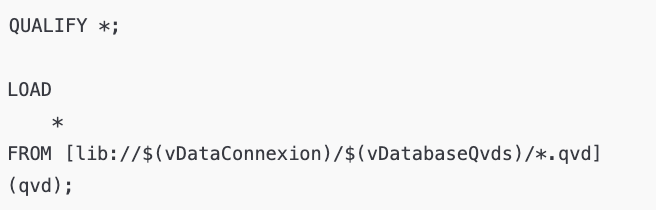
Preparing for Exploration: the “Qualify” Trick
The “Qualify” trick makes it possible to prefix all fields with the name of their source table. The goal is simple: to avoid the automatic creation of links between tables in Qlik’s data model. For this exploration phase, we simply want to inspect the tables in isolation, without any analytical structure.
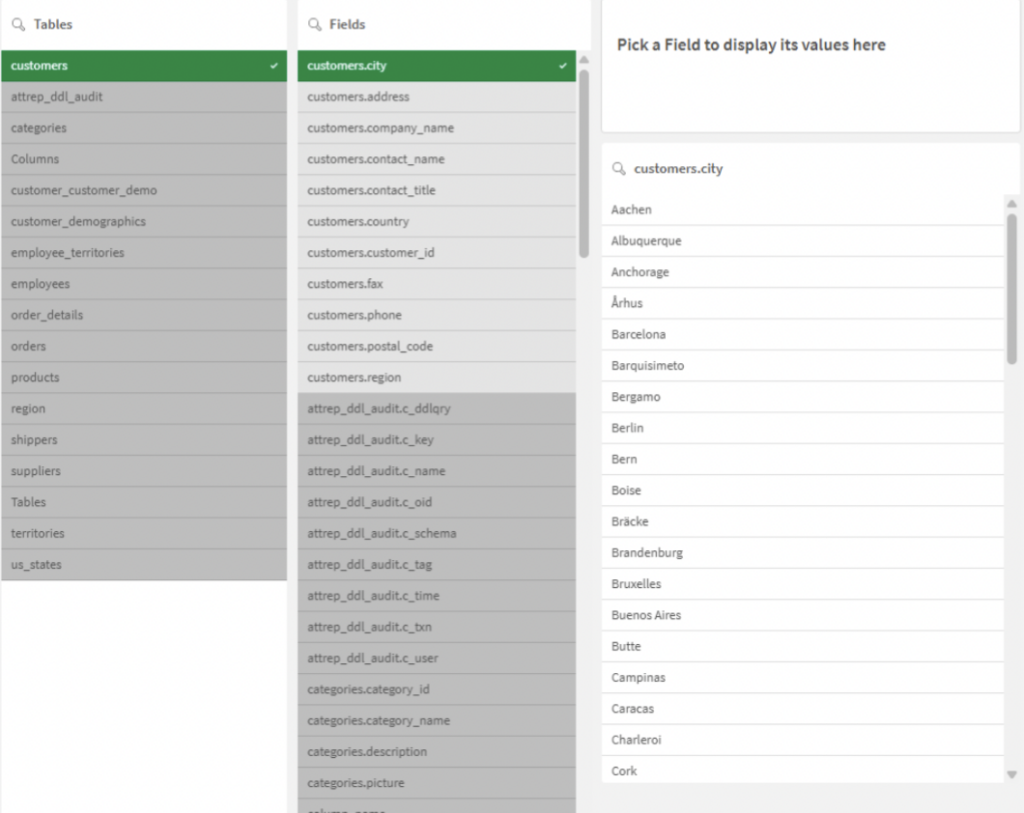
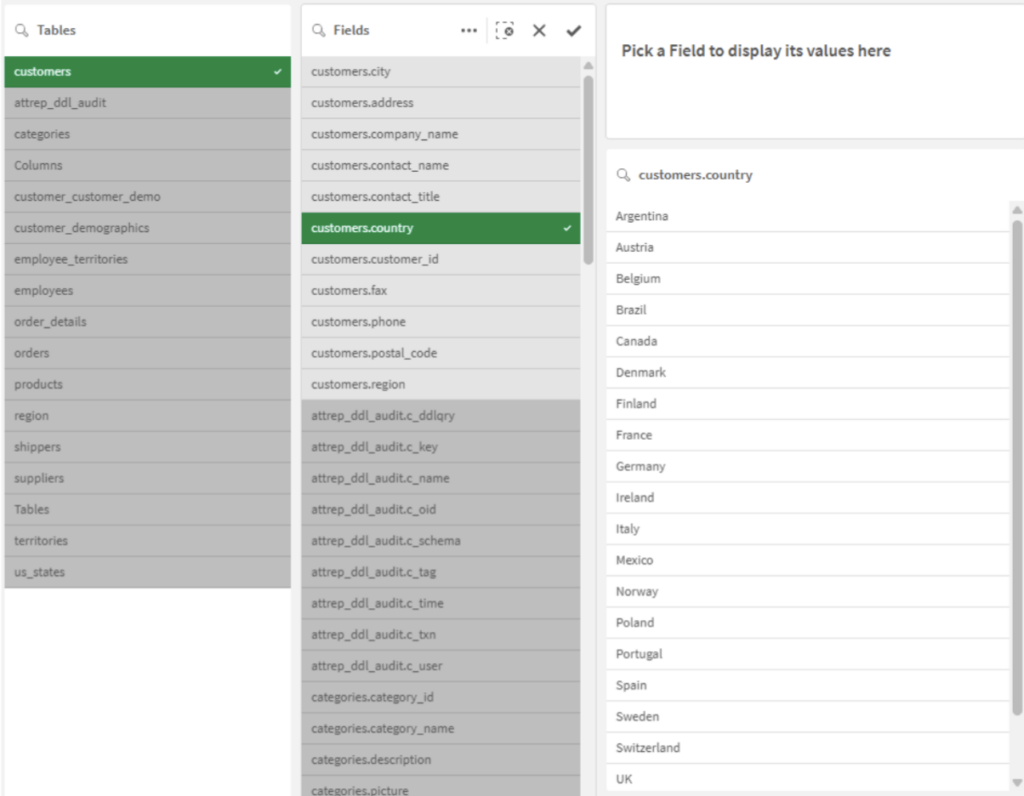
Exploration Using Smart Search
Once the data is loaded, the Qlik application (in a sheet dedicated to exploration) becomes a powerful search tool. If you are looking for a specific value without knowing which field it is stored in, Qlik’s Smart Search is your best ally. It allows you to find data and trace it back to its source, even within a model you don’t yet fully understand.
Optimization for Exploration
To ensure this phase runs quickly, don’t forget to include this variable in your script: d’intégrer cette variable dans votre script :
“SET CreateSearchindexOnReload=0”
This prevents Qlik from indexing the content of all fields during the load, speeding up reload times while you are working on extraction. (Also note that the QVD storage path will be managed through project variables that need to be adjusted depending on your file system.)
This exploration method applies to any Qlik project that relies on a database. Its rapid implementation makes it a valuable tool for both technical and functional decision-making.
Indeed, this exploration environment is ideal for discussions with business experts (developers, users, database administrators) to validate data relevance and define the business rules required for the indicators. métiers (développeurs, utilisateurs, administrateurs de la base de données) afin de valider la pertinence des données et d’établir les règles de gestion nécessaires aux indicateurs.
Here is the sample application to use : Heydata_1 – GoaGS – 1.qvf
Once the source data is fully understood and its future use defined, we can move on to the industrialization stages of the extraction process, which will be the topic of our next article.
See you soon!
Leave a Reply